![]()
Be careful up there!
![]()
Be careful up there!
Too slippery to stand.
I chose to stay on the latter and reach up with a plastic (toy) shovel to remove the snow. The plastic can’t scratch the glass. It’s also light enough that I can wave it around at the end of my arm’s reach. Once the ice dam at the bottom edge was broken free, the snow on the glass slid free… …sometimes into my face…
Hmm. You need a second helper and a long rope.

Of course, that assumes you can keep the rope from snagging on the panels. Either way, do be careful. Don’t be like this guy:
And…
Here it is:
Look at all the power pouring in!
On the winter solstice!
With treetops in the way!
It’s a wonder that these panels can get anything at all, really.
Agree, especially at winter solstice. Not bad, not bad at all!
Cheers to you!
![]() That’s awesome!
That’s awesome!
I’m starting to feel greedy again.
There’s a stream of data coming out of the Sol-Ark inverter to the Sol-Ark website, allowing me to view the status in real-time on my phone. Wonder of modern technology, but…
…I’d like to have access to the raw data myself.
(I’m never satisfied)
This could be used to help me measure the effect of shading on the panels, and enable me to monitor performance against an analytical model. That would alert me to unusual conditions, perhaps before they became problems or faults.
The Sol-Ark data is strictly proprietary once it’s been collected (I read the T&C’s).
Been thinking about adding some extra current clamp-on monitors at various places, to help keep an eye on things, too.
In this case, greed is good! I am surprised about Sol-Ark data; sort of like big brother watching your energy consumption, etc.
Um, perhaps a Raspberry Pi could be used for this situation?
see: GitHub - David00/rpi-power-monitor: Power Monitor (for Raspberry Pi)
I bought 2 of these instruments: https://www.droking.com/AC-80-260V-100A-Lcd-Digital-Voltmeter-Ammeter-Power-Meter-Energy-Meter-AC-110-220V-Multimeter-Current-Transformer-CT
but no data is collected or logged - i searched! Also, the current coil has too small inner diameter for my residential power cables. i could replace, but i prefer to collect/monitor power data. Hence, i’m looking at a raspberry pi.
I’m sure there are other means to get what you need.
“Droking”…
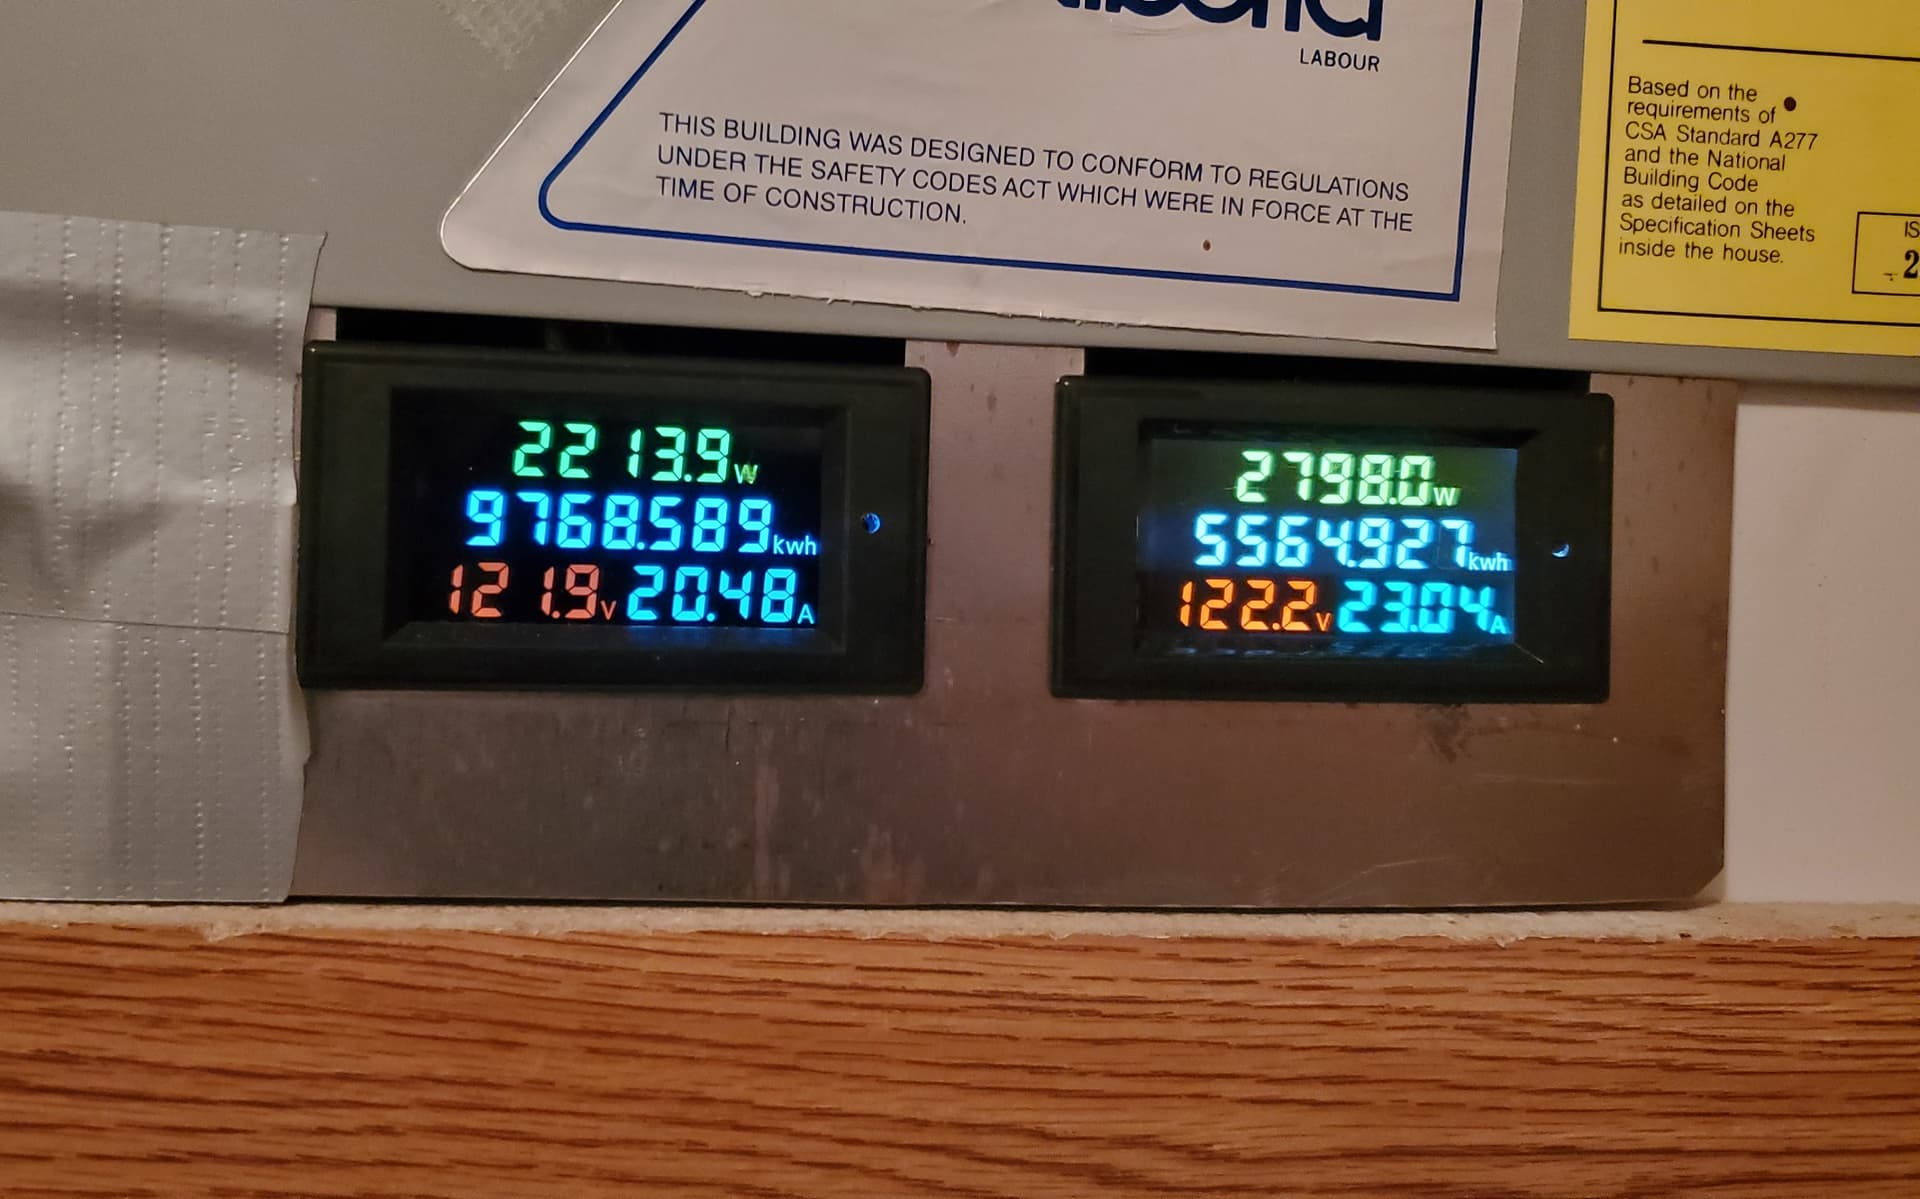
I’ve got two of those already:
Installed just below my house main electrical panel, with a CT on each of the lines. If you look closely, the quantities tell that the clothes dryer was running when I took the photo. After over a year, a difference in consumption in each side of the split-phase has become obvious. I’m thinking of swapping 2 breakers since the circuits on “A” are busier than the “B” circuits.
BTW- This isn’t related to the PV installation. The house electrical panel doesn’t “know” the garage has solar panels on it.
Nonetheless, I have started looking at adding CT’s in various places around different buildings, which would allow me to keep an eye on things. These Droking meters are great but I agree: no data downloads from them, therefore not directly useful for automation.
Is it possible to change to a larger diameter CT?
Old metering trick; run line two through the CT in the opposite direction to line one.
That will put the total consumption on one meter and free up a meter for use elsewhere.
@WaRoss
Good question as i thought the same!
If changing to a larger diameter CT, will that have any impact on the Drok meter displayed values?
i did not know about the metering tidbit - thank you. I will test someday.
That depends on the Drock CTs adhering to industry standard ratings and on finding a matching CT.
Specifically, the secondary rated current,eg; Xprimary:5 or xprimary :1 etc.
Another dodge from “Metering on a Budget” is connecting the CTs in parallel. The impedance of an old school revenue meter was low compared to the impedance of the CT secondaries.
One CT is not able to force a current through the secondary of another CT without inducing a current in the primary of the second CT.
Not going to happen.
When two CTs are connected in parallel on the secondary, there must be an external path for the currents to flow.
Depending on the polarity of the connection, the respective currents will either add or subtract.
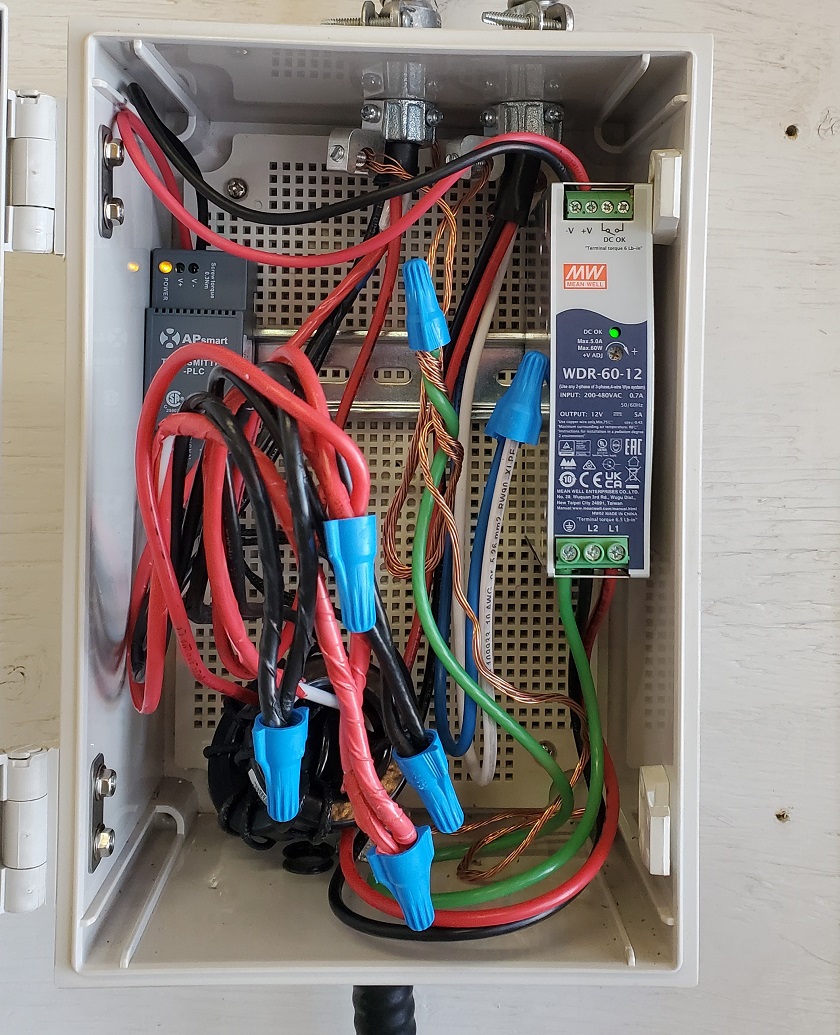
The remote shut-down and its CT’s are an interesting installation.
The RSD needs a 12V DC power supply, so there are two items on the DIN rail. The RSD transmitter itself, and it’s AC/DC converter.
There’s a CT for each of the two branches of PV panels. Each row on the roof is a separate branch, and these are fed to the Inverter’s panel separately. The RSD has two monitoring circuits, too, so there are two CT’s in the box.
Not sure why they went with a 200-300VAC AC/DC converter, when a 120VAC converter would do. The power supply breaker in the panel takes up 2 slots for 240VAC rather than 1. Annoying waste of space. My circuit breaker panel is full, now.
Not sure why they used 29mm cores when there’s only a 10AWG wire running through each. They’re huge. The kit they used can be ordered with optional 11mm CT cores that would have worked fine. Actually the kit they ordered can be supplied with 120VAC power supply so again it makes me wonder.
Anyway here’s a photo of the installation (it’s a crowded box):
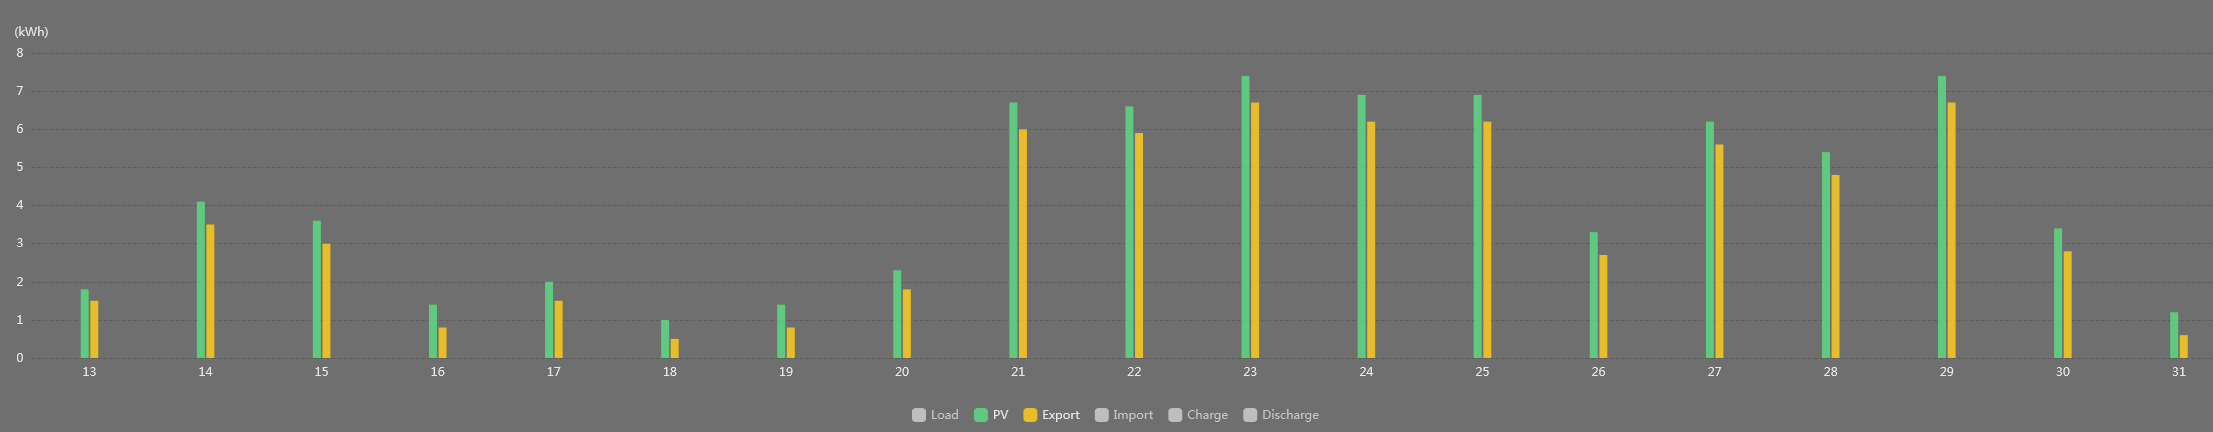
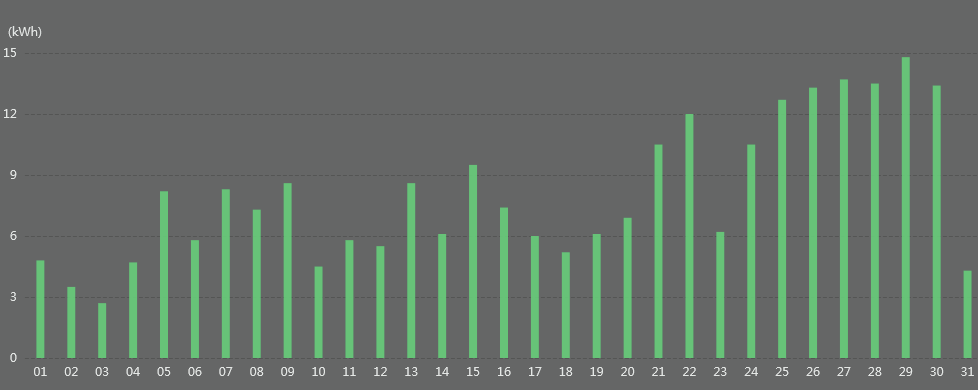
Here’s December:
For the first week, the panels were almost entirely covered in snow, and it was cold, icy and windy. Nobody wanted to go up on the garage roof to sweep them off.
Eventually the weather cooperated, and I clambered up to clear them, which you can clearly see on the 21st when production jumps up. It snowed again on the 31st, so, up I went again…
Yeah, you guys have the big high pressure dome that was sitting over us all thru Dec. and half of January, so clear skies right now? We are finally getting snow in the mountains (and at our house on the 400 ft. foothills, shoveled the driveway for the 3rd time this week/year this morning.
Your first chart showed a lot of the generation exported, are you now hooked up to have house loads borne by the photovoltaics, or did you just not plot the “export” tab? Or maybe “export” is from the garage to the house? Either way, 10-15 kWh is not bad for January.
Funny you ask. Today’s generation was exactly zero. Snow has fallen several times in the past few days, including today, it’s been cloudy, and very cold (below -20C). I haven’t been up to sweep the panels off (knowing it would be pointless) therefore they flat-lined today for the first time since being switched on. Yesterday was also a pathetic 0.7 generated and only 0.1 kWhr exported. The difference was expended on just operating the electronics.
Nice Miata, by the way. Prefer the hard-tops, too.
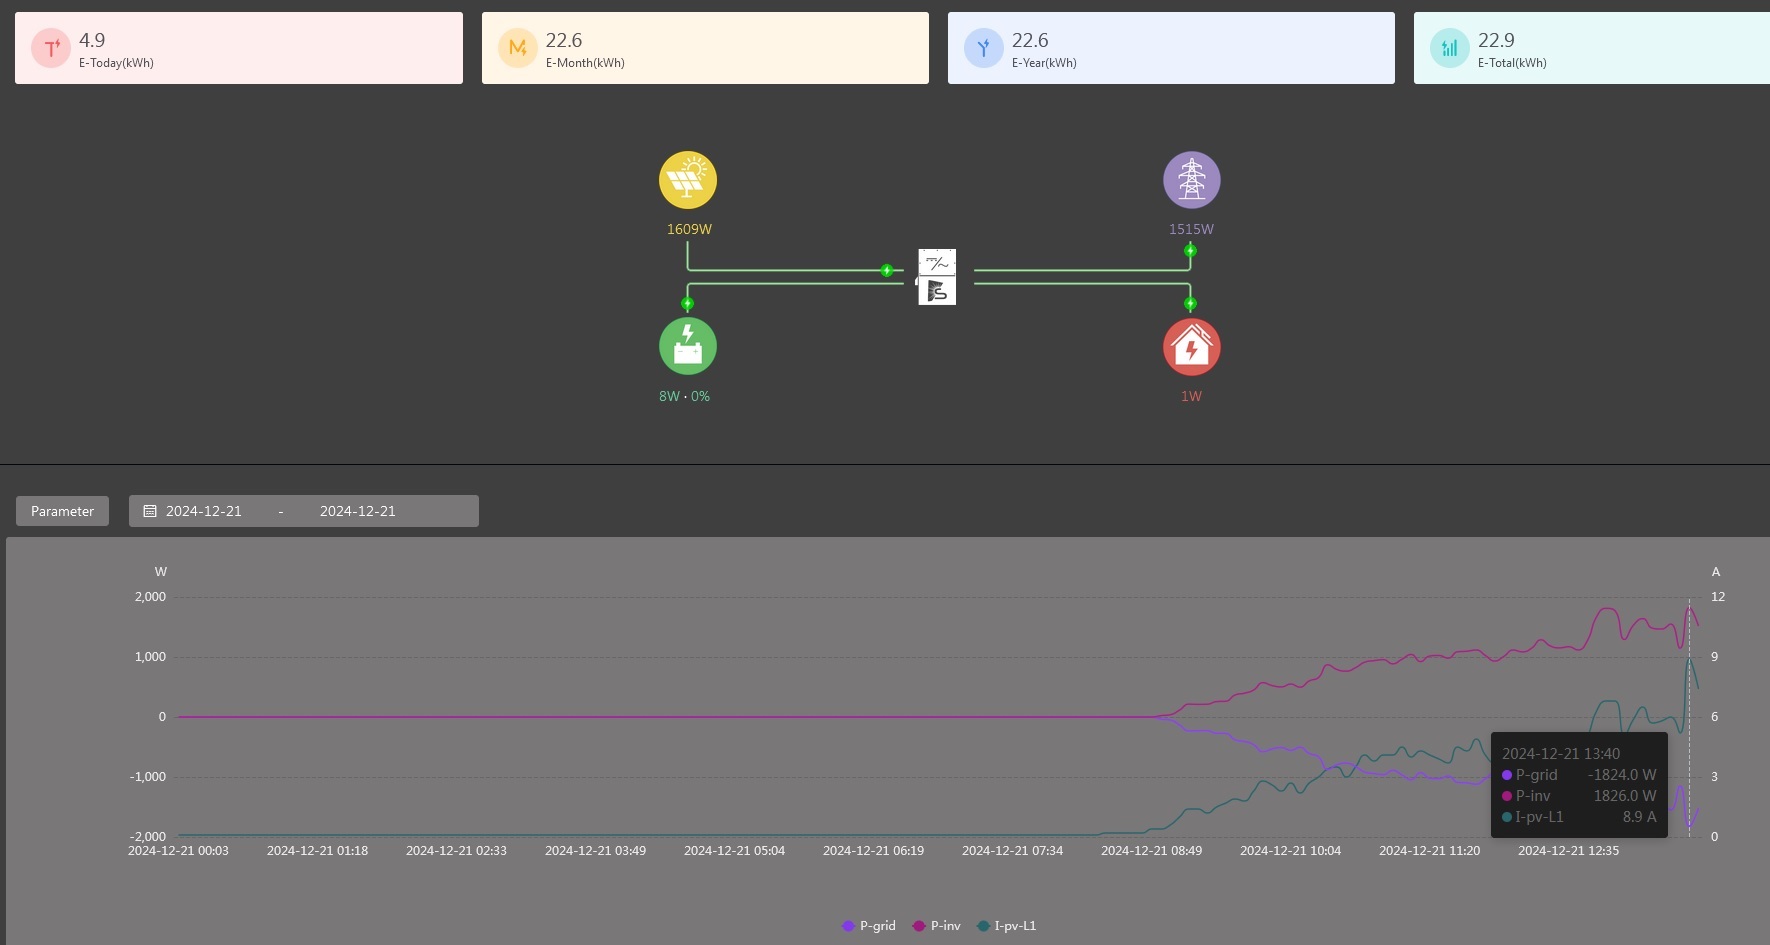
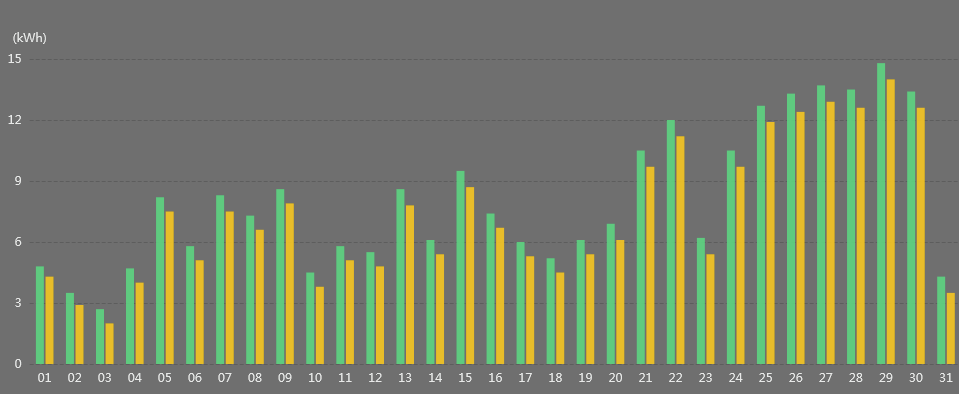
Let me try to do a better job of presenting the data. The graphs I’m sharing are from my Sol-Ark inverter, which has an online interface. There are buttons on the web page to be clicked to show/hide info. This version should have information more relevant to you, and help answer your questions better:
Now you can see production (green) and export (yellow). There is a difference of about 0.8kWhr every day which is to run the electronics (heat loss in the box). Overnight the grid-tie inverter is in power-saving mode and it’s consumption is very small. On a sunny day in the winter, it will switch itself on and operate itself for about 8-9 hours, using about 100Watts to function. The simple math gives 800-900 Watt-hours per day. In the summer, I predict it will run up to 15 hours per day, so it will deduct 1.5kWhr as overhead.
House loads, garage loads, and PV generation all pass through the same “nexus” on common bus-bars, in a distribution box just below my utility meter. That means that my meter cannot tell the difference between my consumption VS my consumption less generation. It can measure generation, as long as there’s a net generation over my consumption. My utility meter doesn’t display any useful numbers except consumption.
The design of my system allows it to passively prioritize self-consumption over sell-back to the utility. Self-consumption reduces my consumption by 1kWhr for every kWhr I generate, which saves me about ~40 cents per kWhr. When selling it back, every 1 kWhr will earn me a paltry 12 cents per kWhr. If possible, my generation in the summer may exceed my consumption, at which point I can ask my provider to switch me to a “solar club” plan which will pay out 30 cents per kWhr when I generate. That’s better than 12c, but not as good as using as much of it myself as I can.
FYI, the only data that I get from my utility comes from the retailer that bills me every month. They only take 1 or 2 measurements during the month, so I don’t know how much generation I actually made in January. I won’t get the bill for another week or so (they bill in mid-month). I’m eager to see how much they think I have generated, since much of my generation has been diverted to house loads (I expect).
Awesome, thanks for the deeper dive, Sparweb. Now the graph makes sense, we see the housekeeping load for the pv inverter. Also the explanation of self-consumption vs. truly exported generation makes sense. Still, 1200 kWh is impressive.